April 1, 2010 by
In a time of financial instability, corporate investments must be
thought out very carefully. That said, some investments can offer
benefits almost immediately after implementation. There is one that can
help you increase operational efficiency, harmonize departmental
reporting, and provide immediate and up-to-date insight on your business
at the click of your mouse. This investment gives you access to view
the many different perspectives of your organization’s most crucial
asset: its data.
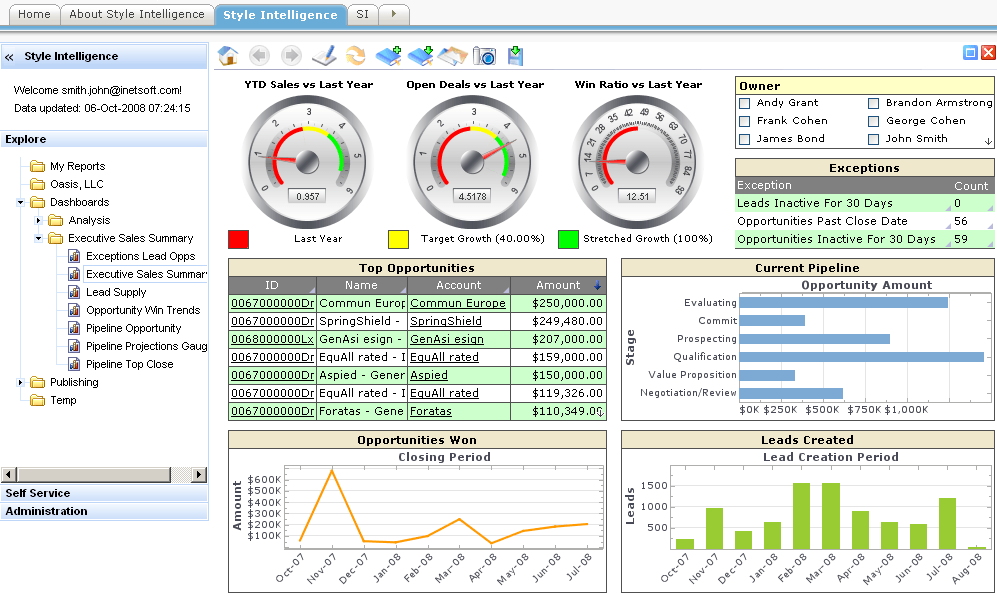
Business Intelligence, more commonly referred to as “BI”, is a term used to describe a set of concepts and methods that enable a company to make better business decisions by using applications sourced from a central and common data architecture. These systems also make it easy to share information across the enterprise via the internet or network connections. A typical BI implementation can provide benefits to groups of all sizes, from ones as small as 15 to 20 users to some as large as 30,000 and most importantly, it offers one common dataset for all to work with, virtually eliminating spreadsheet and personal database clutter. Some other key benefits of BI solution are:
Before answering the question posed above, it must be noted that Gartner, a technology business research firm, cited BI as the number one priority identified by chief information officers around the world (BI topped this list in 2006, 2007 and 2008). That being said, an effective way of making room for BI is to move some of the budget allocated to hardware spending to Business Intelligence. This can be done because of the fact that these toolsets usually harness the power of existing networks and databases, which mean that the investments associated with BI projects are software-related.
Another way of ensuring that BI projects hit the ground running is to limit the reach and thus the deployment of the solution in question. The reason for this is that companies often dive into enterprise-wide BI solutions without regard to the big picture which is usually a recipe for disaster: by using smaller, more targeted areas the impact of potential problems is much smaller. Furthermore, this allows any lessons learned to be applied to all subsequent deployments.
In conclusion, if done properly, Business Intelligence offers many possibilities to reduce operational IT costs and better inform an organization’s employees through up-to-the-minute information. It is this same data that will permit your people to identify and take advantage of the economic downturn by sharing the same dataset across the entire organization. With this in place, all can work on identifying and fixing problems rather than try to catch up with one another because of data inconsistencies.
Business Intelligence, more commonly referred to as “BI”, is a term used to describe a set of concepts and methods that enable a company to make better business decisions by using applications sourced from a central and common data architecture. These systems also make it easy to share information across the enterprise via the internet or network connections. A typical BI implementation can provide benefits to groups of all sizes, from ones as small as 15 to 20 users to some as large as 30,000 and most importantly, it offers one common dataset for all to work with, virtually eliminating spreadsheet and personal database clutter. Some other key benefits of BI solution are:
- Creating a common set of metrics is another great way to extend an existing BI implementation and provide a great return on investment: large amounts of time can be wasted when various departments within an organization use different definitions to describe business terms and actions. By uniting all definitions in one common area, marketplace goals can then be shared across the company.
- Better understand the overall position of the organization with multidimensional views of the data. These types of platforms allow a user to quickly “slice and dice” information by traversing through the enterprises business dimensions. This can greatly facilitate the identification and resolution of potential problems, as well as highlight potential opportunities to take advantage of prevailing market conditions. This type of analysis is provided by the OLAP (Online Analytical Processing) approach which uses multidimensional models to allow for quick analysis and ad-hoc reports.
- By taking advantage of newer BI solutions such as IBM Cognos TM1, executives and managers alike get the flexibility to create “what if” scenarios without the need to store the projected data. By doing so, decision makers can quickly assess the impacts of a strategies on the organization.
- Make employees more productive by granting them rapid access to the information they need to make better decisions rather than overwhelming them with data extracts from disparate data sources. Large amounts of time are wasted on producing reports without proper BI solutions in place.
- A major financial institution used to take up to three weeks to produce essential profit and loss reports for high level executives. The data used to create the spreadsheets was collected from a multitude of database stored procedures which exported their results in Excel format. These outputs were then ported into a Microsoft Access database for manipulation and analysis. By introducing the IBM Cognos 8 suite of tools, this company was able to produce the information they needed in real-time with a click of the mouse. Doing so also meant that much of the financial analysts’ time was freed up to react to the numbers rather than assembling and relating the information.
- A small software manufacturer offered a CRM tool with fully integrated reporting. These reports were programmatically built and therefore were not very flexible. By using IBM Cognos 8, the company was able to tie into their existing database and build reports off of it. In addition to this, the development time required to write the reports was impacted in a positive manner (it now takes much less time to create reports). Also, by providing an easy-to-use graphical report development environment, the manufacturer’s clients can now extend and modify the standard report set deployed with the tool.
- A large international manufacturer was previously inhibited from performing analysis across all global regions and/or operational areas because of the highly compartmentalized nature of their business applications. To address this, the company launched a strategic initiative to create an enterprise data warehouse that would consolidate and conform upwards of 20 disparate source systems, and would utilize IBM Cognos 8 as the new standardized platform for BI. By doing so, the organization was also able to align common business definitions and achieve operational efficiency by reducing the time and effort necessary to gather source data in order to assemble it in management reports.
Before answering the question posed above, it must be noted that Gartner, a technology business research firm, cited BI as the number one priority identified by chief information officers around the world (BI topped this list in 2006, 2007 and 2008). That being said, an effective way of making room for BI is to move some of the budget allocated to hardware spending to Business Intelligence. This can be done because of the fact that these toolsets usually harness the power of existing networks and databases, which mean that the investments associated with BI projects are software-related.
Another way of ensuring that BI projects hit the ground running is to limit the reach and thus the deployment of the solution in question. The reason for this is that companies often dive into enterprise-wide BI solutions without regard to the big picture which is usually a recipe for disaster: by using smaller, more targeted areas the impact of potential problems is much smaller. Furthermore, this allows any lessons learned to be applied to all subsequent deployments.
In conclusion, if done properly, Business Intelligence offers many possibilities to reduce operational IT costs and better inform an organization’s employees through up-to-the-minute information. It is this same data that will permit your people to identify and take advantage of the economic downturn by sharing the same dataset across the entire organization. With this in place, all can work on identifying and fixing problems rather than try to catch up with one another because of data inconsistencies.


